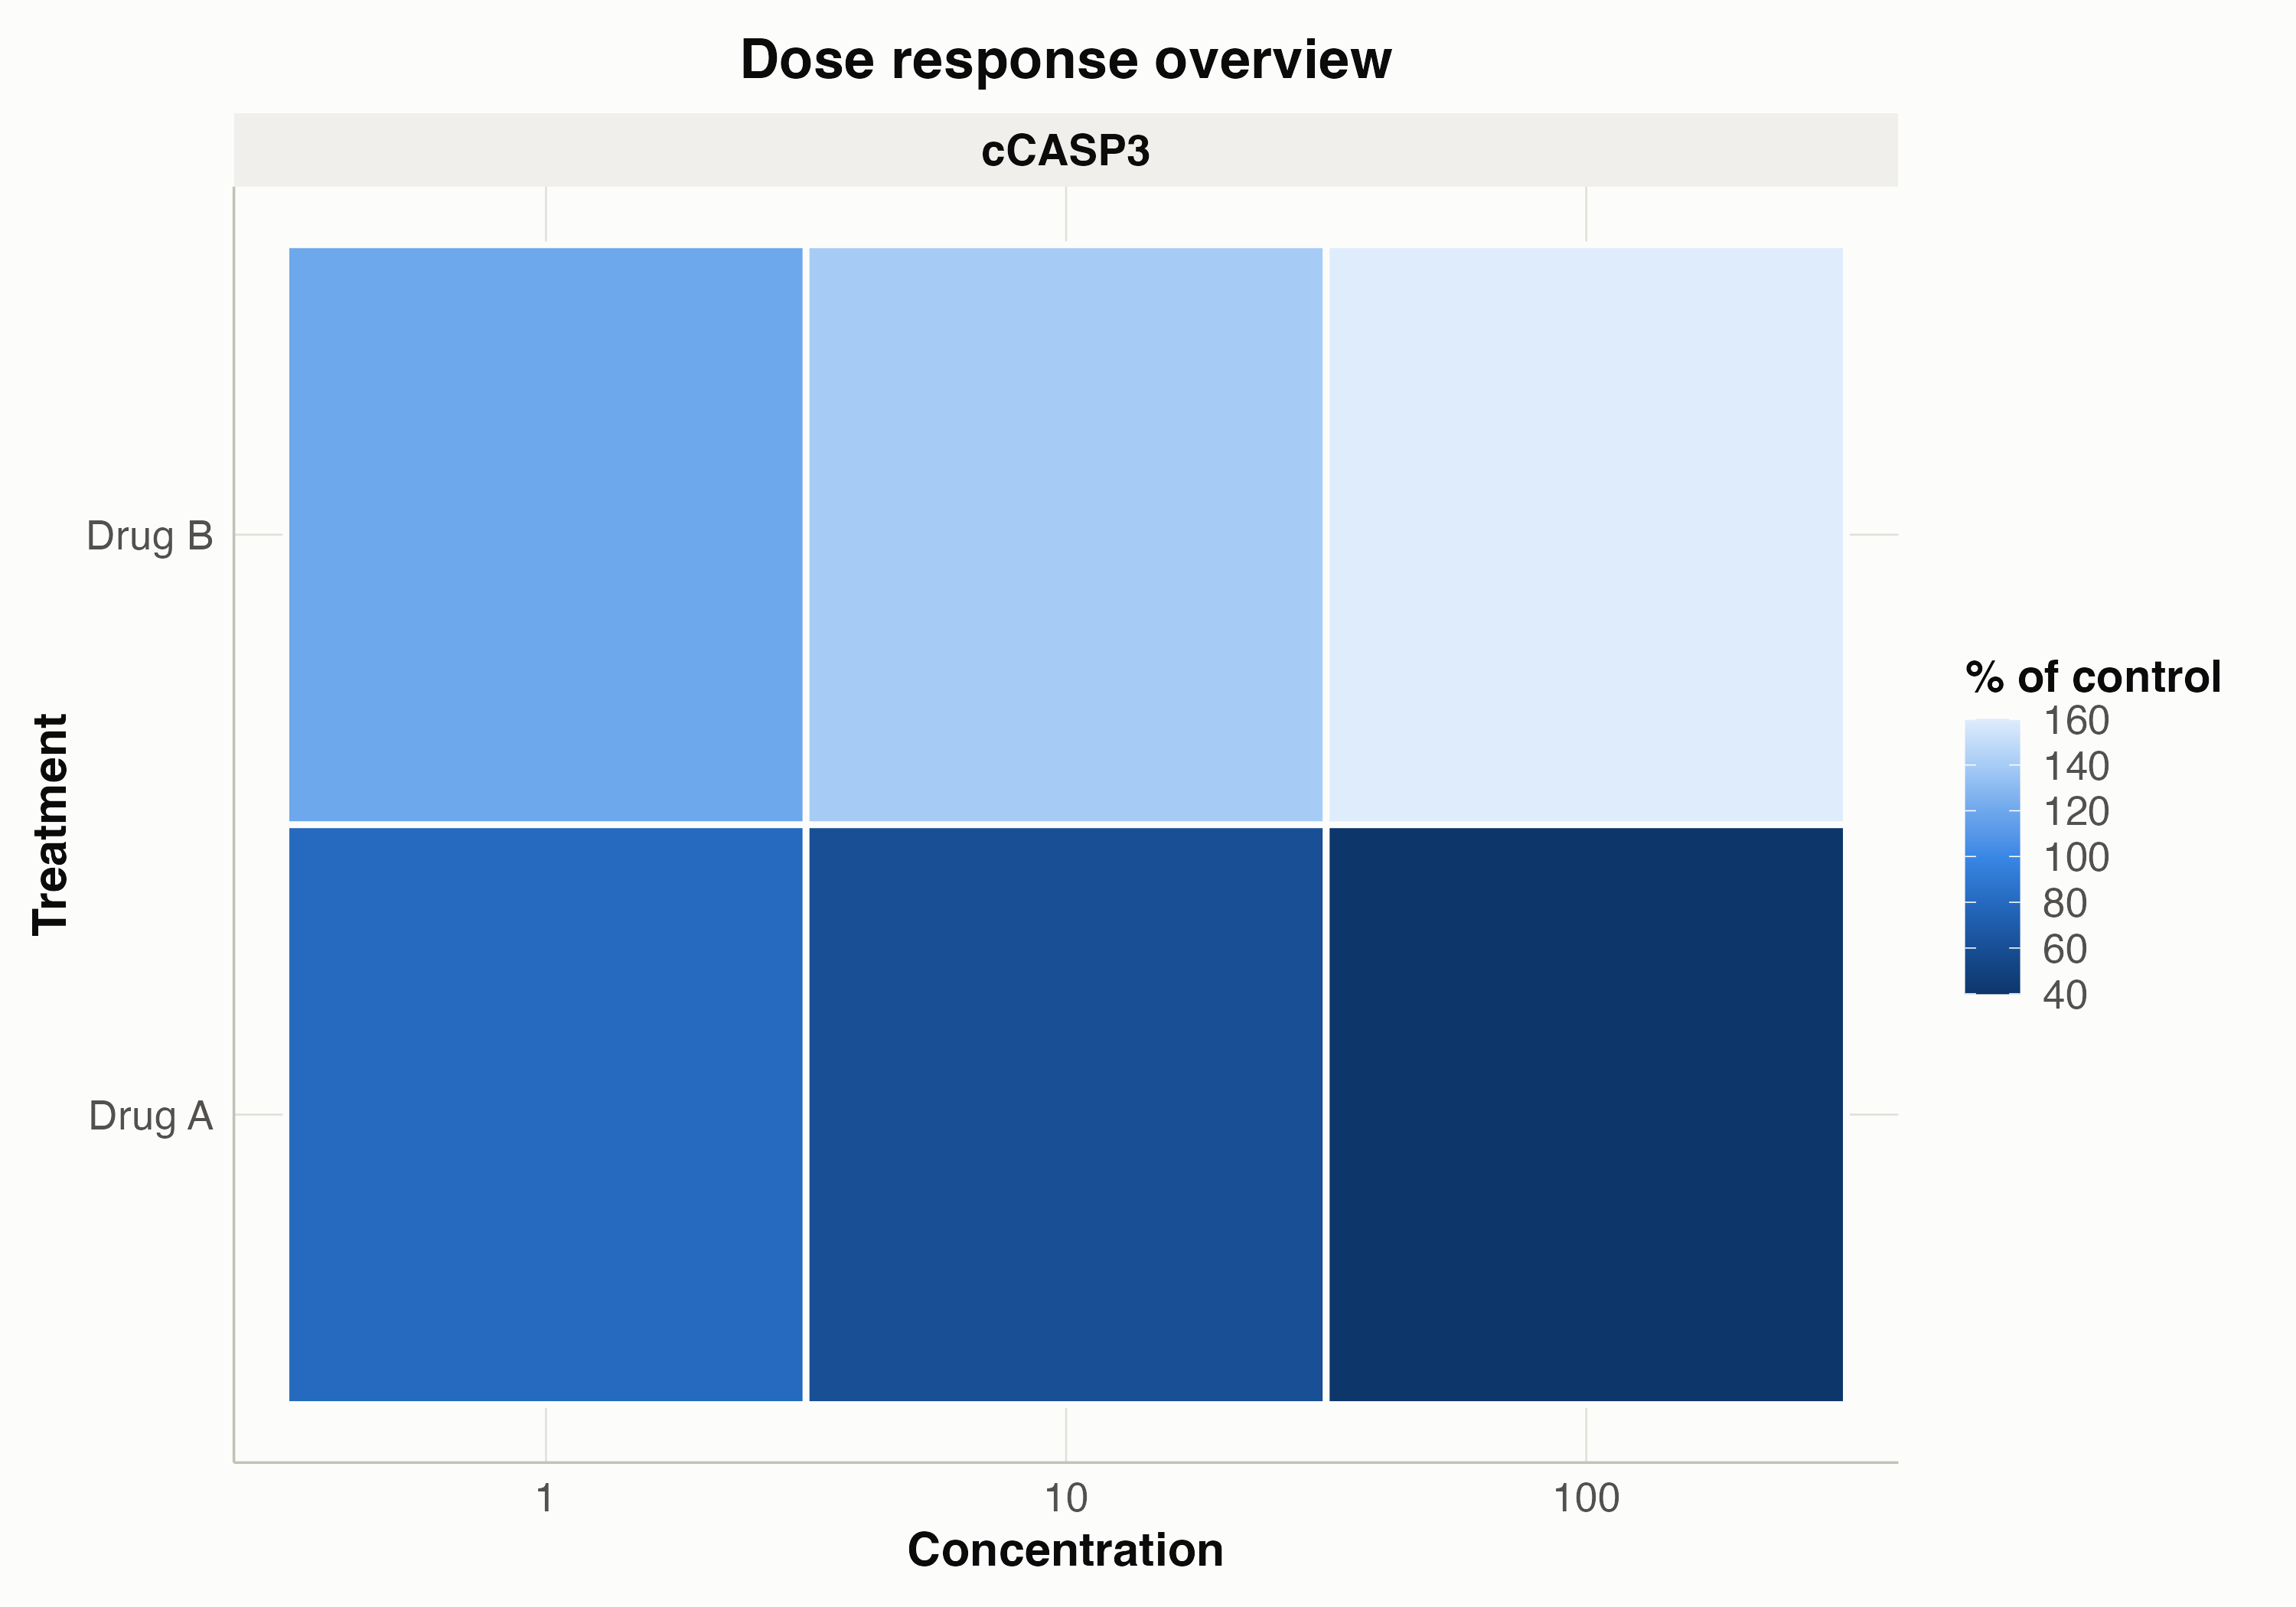
Plot a treatment by concentration heatmap of percent-of-control values
Source:R/normalization.R
plot_dose_response_heatmap.RdSummarizes normalize_to_control() output into a treatment x concentration
heatmap of the mean percent-of-control value, a compact overview of an entire
dose response experiment across many drugs at once.
Usage
plot_dose_response_heatmap(
  .data,
  concentration_column_name = "Concentration1",
  treatment_column_name = "Treatment",
  control_treatment_name = "Control",
  show_values = FALSE
)
Arguments
- .data
Data frame that has been through
normalize_to_control()on the long format (must contain "pct_of_control", "marker_positivity", a concentration column, and a treatment column).- concentration_column_name
Column holding the drug concentration. Defaults to "Concentration1".
- treatment_column_name
Column holding the treatment label. Defaults to "Treatment".
- control_treatment_name
Value identifying control/vehicle wells, excluded from the heatmap. Defaults to "Control".
- show_values
Logical; whether to print the numeric mean
% of controlinside each heatmap tile. Defaults toFALSE.
Examples
df <- data.frame(
  PID = "PID1",
  Treatment = c("Control", "Control", rep(c("DrugA", "DrugB"), each = 3)),
  Concentration1 = c(NA, NA, "1", "10", "100", "1", "10", "100"),
  marker_positivity = "cCASP3",
  marker_positivity_ratio = c(10, 10, 8, 6, 4, 12, 14, 16)
)
normalized <- normalize_to_control(df)
plot_dose_response_heatmap(normalized)